

Monitoring System Performance
This chapter describes each of the System Monitors available in Server Manager. This chapter assumes that you have read Chapter 10, "Overview of the System Monitors," and are familiar with the interface elements of a monitor window. See Chapter 10 for a description of how to start a monitor.
For each monitor, this chapter describes the statistics displayed in the monitor, the filters available in the monitor, the command to invoke the monitor from a worksheet, and the performance tables on which the monitor's view is based.
The System Monitors described in this chapter are:
- Library Cache · System I/O
The Circuit Monitor
The Circuit Monitor displays information about virtual circuits. A virtual circuit is a connection to an instance through a dispatcher and the shared server currently processing the user's request.
The following figure illustrates the left-most columns of the Circuit Monitor.
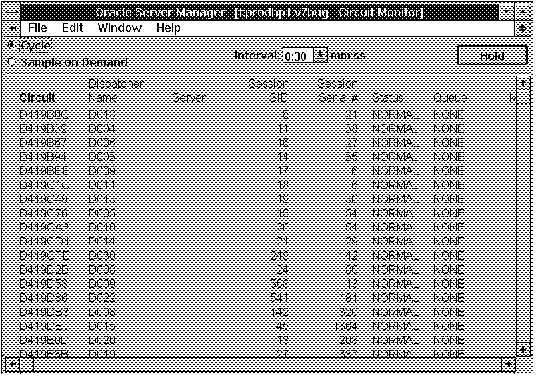 Figure 11 - 1. Circuit Monitor
The Circuit Monitor is described below:
Circuit Address of the virtual circuit.
Dispatcher Name
Name of the dispatcher associated with the virtual circuit.
Server
Name of the shared server currently associated with the virtual circuit.
Session SID
Identifier for the session bound to the virtual circuit.
Session Serial #
Session serial number, used to uniquely identify a session's objects. Guarantees that session-level commands are applied to the correct session objects if the session ends and another session begins with the same session identifier.
Status
Status of the circuit:
BREAK Currently interrupted.
EOF About to be removed.
OUTBOUND A link to a remote database.
NORMAL Normal circuit into the local database.
Queue
Name of the queue the circuit is currently on:
COMMON Waiting for request to be picked up by a server process.
DISPATCHER Waiting for the dispatcher process.
SERVER Waiting for server to finish processing request.
OUTBOUND Waiting to establish an outbound connection.
NONE Idle circuit.
Messages
Total number of messages that have gone through the circuit.
Bytes
Total number of bytes that have gone through the circuit.
SQL Worksheet Equivalent
To start the Circuit Monitor from a SQL Worksheet, you can use the following Server Manager command:
MONITOR CIRCUIT
Required Views
To use the Circuit Monitor, you must have access to:
The Dispatcher Monitor
The Dispatcher Monitor displays information about dispatcher processes.
The following figure illustrates the left-most columns of the Dispatcher Monitor.
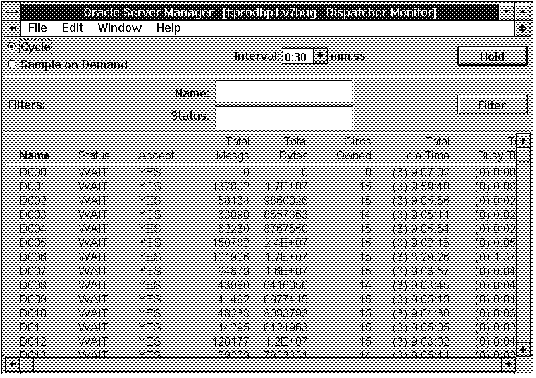 Figure 11 - 2. Dispatcher Monitor
The Dispatcher Monitor is described below:
Name Name of the dispatcher process
Status
Status of the dispatcher process:
WAIT Idle.
SEND Sending a message.
RECEIVE Receiving a message.
CONNECT Establishing a connection.
DISCONNECT Handling a disconnect request.
BREAK Handling a break.
OUTBOUND Establishing an outbound connection.
Accept
Whether this dispatcher is accepting
new connections.
Total Mesgs
Total number of messages processed by
the dispatcher.
Total Bytes
Total size in bytes of the messages processed by the dispatcher.
Circs Owned
Number of virtual circuits owned by the dispatcher.
Total Idle Time
Total idle time for the dispatcher, expressed in:
(Days) Hours : Minutes : Seconds
Total Busy Time
Total busy time for the dispatcher, expressed in:
(Days) Hours : Minutes : Seconds
Load
The fraction of its lifetime that the dispatcher has been busy:
Busy Time/(Busy Time + Idle Time)
Filters
The following filters are available in the Dispatcher Monitor:
Name Filter for dispatcher name. Monitor displays information for dispatchers whose names match the Name filter.
Status
Filter for dispatcher status. Monitor displays information for dispatchers with the specified status.
SQL Worksheet Equivalent
To start the Dispatcher Monitor from a SQL Worksheet, you can use the following Server Manager command:
MONITOR DISPATCHER
Required Views
To use the Dispatcher Monitor, you must have access to:
The File I/O Monitor
The File I/O Monitor contains one row for each file in the database and summarizes the read and write activity for each file. Only Oracle files are shown in the File I/O Monitor.
The following figure illustrates the left-most columns of the File I/O Monitor.
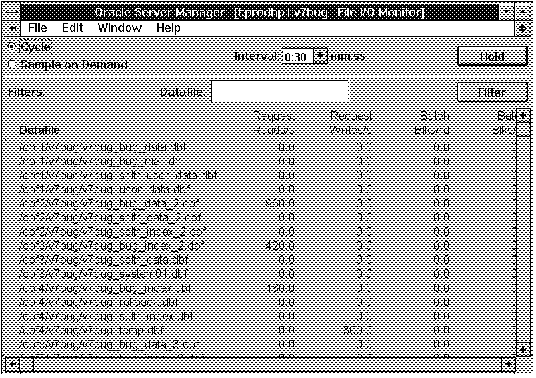 Figure 11 - 3. File I/O Monitor
The File I/O Monitor is described below:
Datafile Name of the database file.
Request Reads/s
Number of physical reads per second since the last sample.
Request Writes/s
Number of physical writes per second since the last sample.
Batch Blks/rd
Number of physical blocks per read since the last sample.
Batch Blks/wt
Number of physical blocks per write since the last sample.
Resp Time ms/rd
Time per read, if TIMED_STATISTICS is TRUE.
Resp Time ms/wt
Time per write, if TIMED_STATISTICS is TRUE.
Attention: Statistics related to time are not collected unless the parameter TIMED_STATISTICS is set to TRUE. For information about setting parameters, see the Oracle7 Server Administrator's Guide.
Filters
The following filter is available in the File I/O Monitor:
Datafile Filter for the name of the database file. Monitor displays information for files whose names match the Datafile filter.
SQL Worksheet Equivalent
To start the File I/O Monitor from a SQL Worksheet, you can use the following Server Manager commands:
MONITOR FILEI/O
MONITOR FILE
Required Views
To use the File I/O Monitor, you must have access to:
Interpreting File I/O Statistics
If the values of Request Reads or Request Writes are high for all files on a given drive, you should consider restructuring your database to allocate database files and tablespaces across additional disk drives.
The product of Request Writes/s and Batch Blks/rd is the amount of data written to the file per second. If this value is high relative to the capacity of the corresponding disk, then you should consider changing the disk to one with a higher transfer rate.
When an index is generated or a SELECT statement is issued, a temporary sort file may be created. Look for excessive I/O to such files. Consider increasing the parameter SORT_AREA_SIZE or assigning different temporary tablespaces to different groups of users. For information about setting parameters, see the Oracle7 Server Administrator's Guide.
The Latch Monitor
The Latch Monitor displays statistics for the latches in the system. Latches are low-level locks on shared internal structures.
The following figure illustrates the left-most columns of the Latch Monitor.
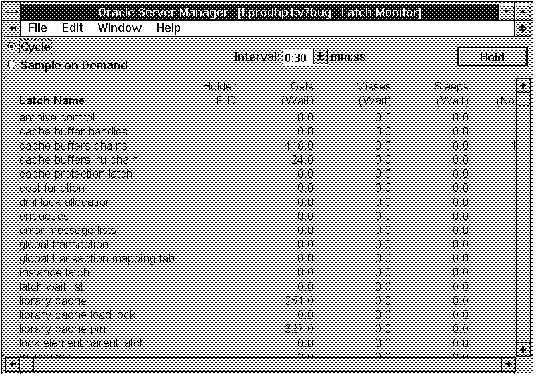 Figure 11 - 4. Latch Monitor
The Latch Monitor is described below:
Latch Name Name of the latch.
Holder PID
Process identifier for process currently holding the latch.
Gets (Wait)
Number of times, since the last sample, a process acquired the latch on its first attempt, but had to wait before acquiring it.
Misses (Wait)
Number of times, since the last sample, a process acquired the latch after failing on its first attempt.
Sleeps (Wait)
Number of times, since the last sample, a process went to sleep while waiting for the latch.
Gets (No Wait)
Number of times, since the last sample, a process acquired the latch without waiting.
Misses (No Wait)
Number of times, since the last sample, a process failed to acquire the latch and did not wait.
Attention: In the Latch Monitor you can only sort on the Latch Name and Holder PID columns.
SQL Worksheet Equivalent
To start the Latch Monitor from a SQL Worksheet, you can use the following Server Manager command:
MONITOR LATCH
Required Views
To use the Latch Monitor, you must have access to:
The Library Cache Monitor
The Library Cache Monitor displays statistics about performance of the library cache. The library cache contains shared cursors and is part of the shared pool in the SGA.
The following figure illustrates the left-most columns of the Library Cache Monitor.
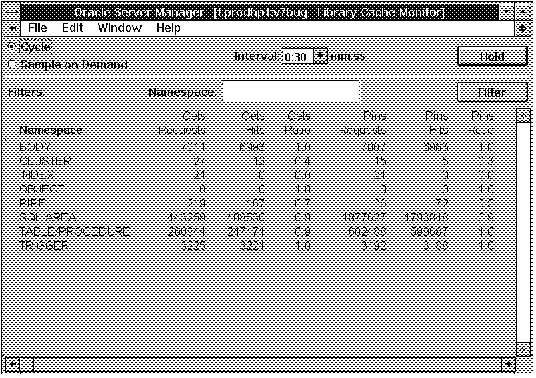 Figure 11 - 5. Library Cache Monitor
The Library Cache Monitor is described below:
Name Space Name of the library cache item. Statistics for the following Name Space items reflect activity for SQL statements and PL/SQL blocks:
Statistics for other Name Space items reflect activity for object definitions Oracle uses for dependency maintenance.
Gets Requests
Number of times the system requests handles to library objects belonging to the name space.
Gets Hits
Number of times the requested handle is already allocated in the cache.
If the handle is not already allocated, it is a miss. The handle is then allocated and inserted into the cache.
Gets Ratio
Number of Gets Hits divided by Gets Requests.
Values close to 1 indicate that most of the handles the system has tried to get were in the cache.
Pins Requests
Number of times the system issues pin requests for library objects in the cache to access them.
Pins Hits
Number of times the system pinned and accessed objects that were already allocated and initialized in the cache. Otherwise, it is a miss, and the system has to allocate the object in the cache and initialize it.
Pins Ratio
Number of Pins Hits divided by Pins Requests.
Values close to 1 indicate that most of the objects the system has tried to pin and access were in the cache.
Reloads
Number of times library objects had to be reinitialized and reloaded with data because they had been aged out or invalidated.
Invalidations
Number of times that non-persistent library objects, such as shared SQL areas, have been invalidated.
Filters
The following filter is available in the Library Cache Monitor:
Name Space Filter for the type of library cache object. Monitor displays statistics only for those objects in name spaces that match the Name Space filter.
SQL Worksheet Equivalent
To start the Library Cache Monitor from a SQL Worksheet, you can use the following Server Manager commands:
MONITOR LIBRARYCACHE
MONITOR LIBRARY
Required Views
To use the Library Cache Monitor, you must have access to:
The Lock Monitor
The Lock Monitor displays information about locks that are held and locks that are requested.
The following figure illustrates the left-most columns of the Lock Monitor.
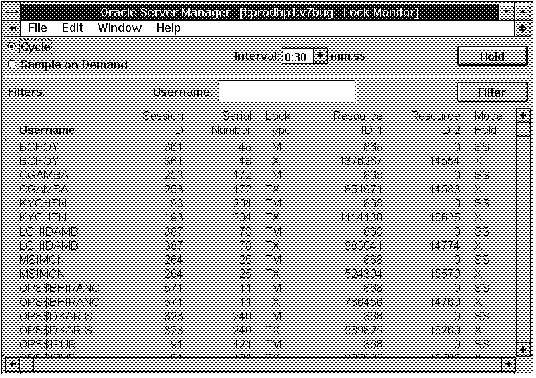 Figure 11 - 6. Lock Monitor
The Lock Monitor is described below:
Username Oracle user associated with the session that is holding or requesting the lock.
Session ID
Identifier for the session that is holding or requesting the lock.
Serial Number
Session serial number, used to uniquely identify a session's objects. Guarantees that session-level commands are applied to the correct session objects if the session ends and another session begins with the same session identifier.
Lock Type
Type of lock being held or requested. User locks, which are locks obtained by user applications, are described below:
TM DML enqueue lock.
TX Transaction enqueue lock.
UL User supplied lock.
All other locks are system locks, which are held for extremely short periods of time.
Resource ID 1
Identifier for resource being locked.
Resource ID 2
Additional identifier for resource being locked.
Mode Held
Mode in which the lock is held, or NONE if waiting for the lock. The lock modes are described below:
SS Row share.
SX Row exclusive.
S Share.
SSX Share row exclusive.
X Exclusive.
Mode Requested
Mode in which lock has been requested, or NONE if the lock has been acquired. See the lock modes defined above.
Filters
The following filter is available in the Lock Monitor:
Username Filter for the user associated with the session that is holding or requesting the lock. Monitor displays lock information only for users whose names match the Username filter.
SQL Worksheet Equivalent
To start the Lock Monitor from a SQL Worksheet, you can use the following Server Manager command:
MONITOR LOCK
Required Views
To use the Lock Monitor, you must have access to:
The Process Monitor
The Process Monitor shows the background and user processes for the instance.
The following figure illustrates the left-most columns of the Process Monitor.
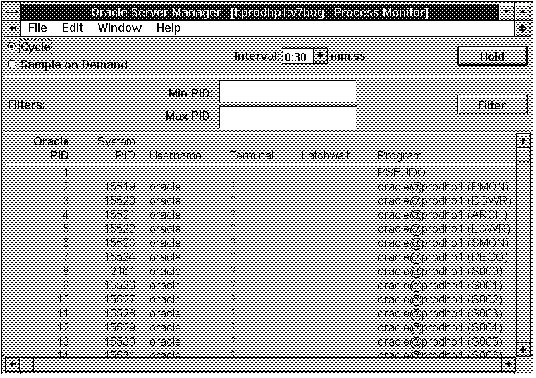 Figure 11 - 7. Process Monitor
The Process Monitor is described below:
Oracle PID Oracle process identifier.
System PID
Operating system process identifier.
Username
Username associated with the operating system process.
Terminal
Operating system terminal, if any.
Latchwait
Address of the latch the process is waiting for, or null if not waiting for a latch.
Program
Name of the program the process is executing.
Filters
The following filters are available in the Process Monitor:
Min PID Minimum process ID. Monitor displays processes with ID numbers greater than or equal to Min PID.
Max PID
Maximum process ID. Monitor displays process with ID numbers less than or equal to Max PID.
SQL Worksheet Equivalent
To start the Process Monitor from a SQL Worksheet, you can use the following Server Manager command:
MONITOR PROCESS
Required Views
To use the Process Monitor, you must have access to:
The Queue Monitor
The Queue Monitor displays information about the queues used in the multi-threaded server.
The following figure illustrates the left-most columns of the Queue Monitor.
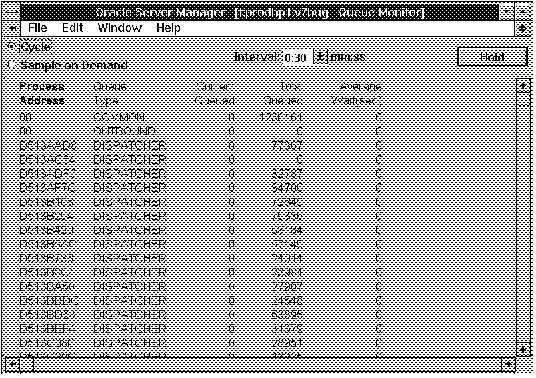 Figure 11 - 8. Queue Monitor
The Queue Monitor is described below:
Process Address Address of the process that owns the queue.
Queue Type
The type of queue:
COMMON Request queue.
OUTBOUND Queue used by remote servers.
DISPATCHER Response queue.
Current Queued
Number of items in the queue.
Total Queued
Total number of items that have ever been in the queue.
Average Wait (sec)
Average time an item waits in the queue, in seconds.
SQL Worksheet Equivalent
To start the Queue Monitor from a SQL Worksheet, you can use the following Server Manager command:
MONITOR QUEUE
MONITOR Q
Required Views
To use the Queue Monitor, you must have access to:
The Rollback Monitor
The Rollback Monitor displays statistics and information about online rollback segments. The following figure illustrates the left-most columns of the Rollback Monitor.
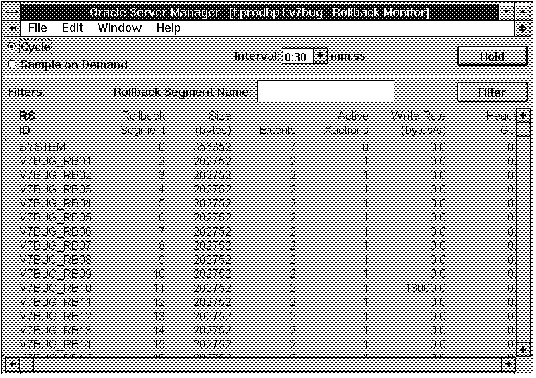 Figure 11 - 9. Rollback Monitor
The Rollback Monitor is described below:
RS ID Name of the rollback segment.
Rollback Segment
Rollback segment number.
Size (bytes)
Size of the rollback segment, in bytes.
Extents
Number of extents in the rollback segment.
Active Xactions
Number of active transactions using the rollback segment.
Write Rate (bytes/s)
Rate at which bytes were written to the rollback segment since the last sample.
Header Gets
Number of times the rollback segment's header was accessed since the last sample.
Header Waits
Number of times a process had to wait to access the rollback segment's header since the last sample.
Optimal Size
Optimal size of the rollback segment.
HWM Size
High water mark for the rollback segment (the largest size the rollback segment has grown to), in bytes.
Average Active
Current average size of active extents (extents that contain uncommitted transaction data), in bytes.
Average Shrink
Total size of freed extents divided by number of shrinks, in bytes.
Wraps
Number of times the rollback segment wraps from one extent to another.
Extends
Number of times the rollback segment was extended and allocated a new extent.
Shrinks
Number of times the rollback segment shrank, deallocating one or more extents.
Attention: In the Rollback Monitor you can sort on the RS ID, Rollback Segment, Size, Extents, Active Xactions, Optimal Size, HWM Size, Average Active, Average Shrink, Wraps, Extends, and Shrinks columns.
Filters
The following filter is available in the Rollback Monitor:
Rollback Segment Name Filter for the rollback segment name. Monitor displays information only for rollback segments whose names match the Rollback Segment Name filter.
SQL Worksheet Equivalent
To start the Rollback Monitor from a SQL Worksheet, you can use the following Server Manager command:
MONITOR ROLLBACK
Required Views
To use the Rollback Monitor, you must have access to:
Interpreting Rollback Statistics
When you have multiple rollback segments, the values in the Header Gets column should be roughly equal for all rollback segments. This indicates that the rollback segments are being accessed evenly.
If the value in the Extents column is high, you may want to create additional rollback segments or increase the size of current segments.
A high value in the Header Waits column indicates contention for the headers of rollback segments. In this case, you should consider adding more rollback segments.
The Session Monitor
The Session Monitor displays information about users' sessions.
The following figure illustrates the left-most columns of the Session Monitor.
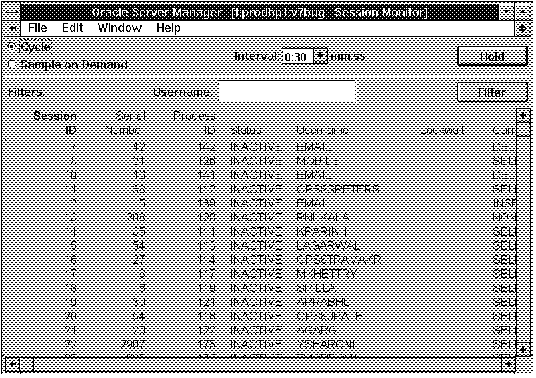 Figure 11 - 10. Session Monitor
The Session Monitor is described below:
Session ID Identifier for the session.
Serial Number
Session serial number, used to uniquely identify a session's objects. Guarantees that session-level commands are applied to the correct session objects if the session ends and another session begins with the same session identifier.
Process ID
Oracle identifier for the process that owns the session.
Status
Status of the session: ACTIVE, INACTIVE, KILLED.
Username
Oracle user associated with the session.
Lockwait
Address of the lock the session is waiting for, or null if not waiting for a lock.
Current Statement
Command currently executing.
Filters
The following filter is available in the Session Monitor:
Username Filter for the user associated with the session. Monitor displays information for sessions whose users match the Username filter.
SQL Worksheet Equivalent
To start the Session Monitor from a SQL Worksheet, you can use the following Server Manager command:
MONITOR SESSION
Required Views
To use the Session Monitor, you must have access to:
The Shared Server Monitor
The Shared Server Monitor displays information about shared server processes.
The following figure illustrates the left-most columns of the Shared Server Monitor.
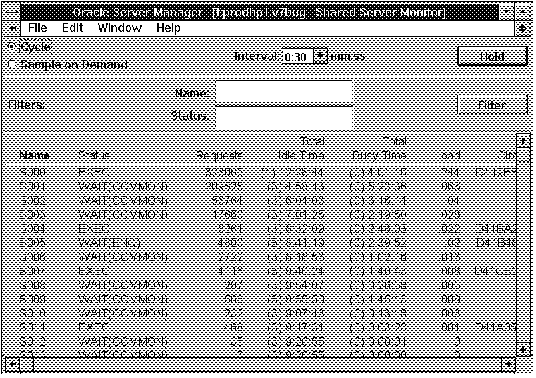 Figure 11 - 11. Shared Server Monitor
The Shared Server Monitor is described below:
Name Name of the shared server process.
Status
Status of the shared server process.
EXEC Executing SQL.
WAIT (ENQ) Waiting for a lock.
WAIT (SEND) Waiting to send data to the user.
WAIT (COMMON) Idle, waiting for a user request.
WAIT (RESET) Waiting for a circuit to reset after a break.
QUIT Terminating.
Requests
Total number of requests taken from the request queue by the server.
Total Idle Time
Total idle time for the server, expressed in:
(Days) Hours : Minutes : Seconds
Total Busy Time
Total busy time for the server, expressed in:
(Days) Hours : Minutes : Seconds
Load
The fraction of its lifetime that the server has been busy:
Busy Time/(Busy Time + Idle Time)
Circuit
The address of the circuit that the server is currently serving.
Filters
The following filters are available in the Shared Server Monitor:
Name Filter for shared server name. Monitor displays information for servers whose names match the Name filter.
Status
Filter for the shared server status. Monitor displays information for servers with the specified status.
SQL Worksheet Equivalent
To start the Shared Server Monitor from a SQL Worksheet, you can use the following Server Manager commands:
MONITOR SHAREDSERVER
MONITOR SHARED
Required Views
To use the Shared Server Monitor, you must have access to:
The SQL Area Monitor
The SQL Area Monitor displays information about shared cursors in the library cache. Each shared cursor contains information used to execute its SQL statement or PL/SQL block. Each row in the monitor shows statistics for one shared cursor.
The following figure illustrates the left-most columns of the SQL Area Monitor.
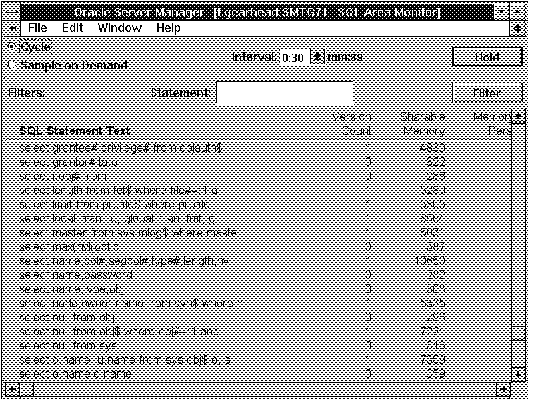 Figure 11 - 12. SQL Area Monitor
The SQL Area Monitor is described below:
SQL Statement Text Text of the cursor's SQL statement or the PL/SQL anonymous code.
Version Count
Number of different versions of the cursor
The same text might be used by different users, each on their own version of an object. For example, if users SCOTT and BLAKE own EMP tables and execute the statement SELECT * FROM emp, they each have a different version of the cursor.
Sharable Memory
Amount of memory in bytes that can be shared between users.
Memory/User Persistent
For each user, the amount of memory in bytes that persists for the life of the cursor. Persistent memory is retained between executions of the statement.
Memory/User Runtime
For each user, the amount of memory in bytes that is needed only during execution. Runtime memory exists only while the statement is being executed.
Filters
The following filter is available in the SQL Area Monitor:
Statement Filter for the statement text. Monitor displays information for cursors whose text matches the Statement filter.
SQL Worksheet Equivalent
To start the SQL Area Monitor from a SQL Worksheet, you can use the following Server Manager commands:
MONITOR SQLAREA
MONITOR SQL
Required Views
To use the SQL Area Monitor, you must have access to:
The System I/O Monitor
The System I/O Monitor displays the percentage of input/output activity generated by background and user processes accessing the database. The statistics shown are relative distributions among the processes, not precise counts of I/O operations.
The following figure illustrates the left-most columns of the System I/O Monitor.
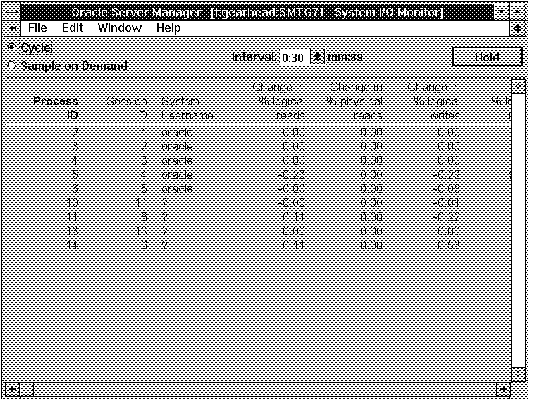 Figure 11 - 13. System I/O Monitor
The System I/O Monitor is described below:
Process ID Oracle process identifier.
Session ID
Session identifier.
System Username
Username associated with the system process.
Change in % logical reads
Change in the percentage logical reads for the process since the last sample.
Change in % physical reads
Change in the percentage physical reads for the process since the last sample.
Change in % logical writes
Change in the percentage logical writes for the process since the last sample.
Total % logical reads
Logical reads for the process as a percentage of all logical reads since startup.
Total % physical reads
Physical reads for the process as a percentage of all physical reads since startup.
Total % logical writes
Logical writes for the process as a percentage of all logical writes since startup.
Attention: In the System I/O Monitor you can only sort on the Process ID, Session ID, and System Username columns.
SQL Worksheet Equivalent
To start the System I/O Monitor from a SQL Worksheet, you can use the following Server Manager commands:
MONITOR SYSTEMI/O
MONITOR SIO
Required Views
To use the System I/O Monitor, you must have access to:
The System Statistics Monitor
The System Statistics Monitor displays the runtime statistics on system use and performance for the current instance.
The following figure illustrates the left-most columns of the System Statistics Monitor.
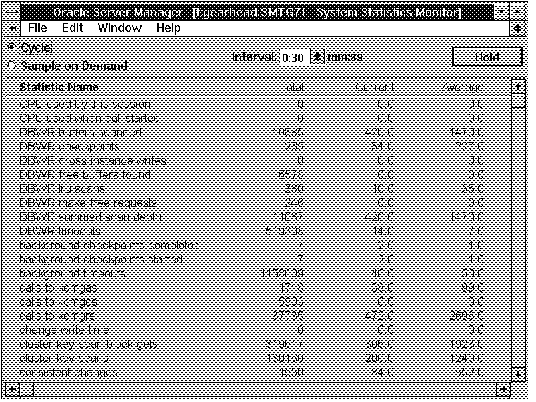 Figure 11 - 14. System Statistics Monitor
The System Statistics Monitor is described below:
Statistic Name Name of the statistic.
Total
Cumulative value of the statistic.
Current
Value of the statistic since the last sample.
Average
Average value of the statistic since you started the monitor.
Minimum
Minimum value of the statistic since you started the monitor.
Maximum
Maximum value of the statistic since you started the monitor.
Attention: In the System Statistics Monitor you can only sort on the Statistic Name and Total columns.
SQL Worksheet Equivalent
To start the System Statistics Monitor from a SQL Worksheet, you can use the following Server Manager command:
MONITOR SYSTEMSTATISTICS
MONITOR SS
Required Views
To use the System Statistics Monitor, you must have access to:
Interpreting System Statistics
Most statistics in the System Statistics Monitor are shown as rates per second. The exceptions are noted in the statistics descriptions at the end of this section.
Attention: Statistics related to time are not collected unless the parameter TIMED_STATISTICS is set to TRUE. For information about setting parameters, see the Oracle7 Server Administrator's Guide.
System Statistics
The following tables describe the system statistics shown in the System Statistics Monitor.
User Statistics
User statistics provide information on CPU and resource use by Oracle users, and also the calls, commits, and rollbacks the users initiate. The System Statistics Monitor covers all sessions. The following table describes the user statistics.
| User Statistic
| Description
|
| CPU used by this session
| Amount of CPU time used in 1/100's of a second.
|
| logons cumulative
| On a systemwide basis, the number in the CURRENT column is the number of new logons this cycle and always equals the corresponding number in current logons. On a per-process basis, this number is always 0 or 1. The number in the TOTAL column is the number of processes that have ever logged on and is cumulative from the last warm start.
|
| opened cursors cumulative
| The total number of cursors that have been opened.
|
| logons current
| The number of current logons.
|
| opened cursors current
| The number of cursors that are currently open.
|
| cursor authentications
| The number of times that cursor privileges have been verified, either for a SELECT or because privileges were revoked from an object, causing all users of the cursor to be re-authenticated.
|
| session logical reads
| The number of logical disk reads that were satisfied either from the cache or by a physical read from the disk.
|
| session pga memory max
| Maximum amount of PGA memory ever used.
|
| session uga memory max
| Maximum amount of system memory ever used.
|
| session pga memory
| Amount of PGA memory currently in use.
|
| recursive calls
| The number of recursive calls including data dictionary operations. A high number indicates that information is not being found often enough in the dictionary cache. This could be because parsing is occurring (too) often or because the cache is not large enough. You should consider increasing the initialization parameter SHARED_POOL_SIZE.
|
| recursive cpu usage
| The amount of CPU time (in 1/100's of a second) that was spent updating internal tables while processing user SQL statements; for example, time spent doing space allocation. A high value indicates a lot of data dictionary work.
|
| session connect time
| The total elapsed time that the session has been connected to the server, in 1/100's of a second.
|
| session uga memory
| Amount of used session memory.
|
| session stored procedure space
| The number of bytes allocated to stored procedures used in the session.
|
| user calls
| The number of user calls processed.
|
| user commits
| The number of transactions for this process or systemwide. This number should equal USER CALLS minus USER ROLLBACKS.
|
| user rollbacks
| The number of rollbacks for this process.
|
Table 11 - 1. User Statistics
Redo Statistics
Redo statistics provide information on the redo log files. The following table describes the redo statistics.
| Redo Statistic
| Description
|
| redo blocks written
| The total number of redo blocks written.
|
| redo buffer allocation retries
| The total number of retries necessary to allocate space in the redo buffer. Retries are needed either because the redo writer has fallen behind or because an event such as a log switch is occurring.
|
| redo entries
| The number of redo entries generated.
|
| redo entries linearized
| The number of entries less than or equal to REDO_ENTRY_PREBUILD_THRESHOLD. Building these entries requires additional CPU time but increases concurrency on multiple-user systems.
|
| redo log space requests
| Number of times LGWR was given a request to write a redo log buffer.
|
| redo log space wait time
| Time spent waiting for log space (in 1/100's of a second). A very high or rapidly increasing value may indicated a problem with log archiving.
|
| redo log switch interrupts
| The count of times an instance log-switch was requested by another instance when running in parallel mode.
|
| redo ordering marks
| Number of extra SCN's allocated to maintain ordering of redo logs, as a result of blocks migrating from one instance's cache to another. The count of these pings is a measurement of cross-talk between instances when running in parallel mode. If this value is very high, it may indicate a need for a better separation of instance-activities.
|
| redo size
| The amount of redo generated in bytes.
|
| redo small copies
| The total number of entries less than or equal to LOG_SMALL_ENTRY_MAX_SIZE. These entries are copied under the protection of the allocation latch, eliminating the necessity of the copy latch. This statistic generally is applicable to only multiple-processor systems.
|
| redo wastage
| Cumulative total of unused bytes that were written to the log. The redo buffer is flushed periodically even when not completely filled, so this value may be nonzero.
|
| redo write time
| Cumulative elapsed time spent on log I/O.
|
| redo writes
| The total number of redo writes.
|
Table 11 - 2. Redo Statistics
Enqueue Statistics
Enqueue statistics provide information about the locks. The following table describes the enqueue statistics.
| Enqueue Statistic
| Description
|
| enqueue requests
| Number of times an enqueue (lock) was requested.
|
| enqueue waits
| The number of times an enqueue request resulted in a wait. Enqueue requests minus enqueue waits is the number of no-wait enqueue requests.
|
| enqueue timeouts
| The number of times an enqueue (lock) request was not granted within the allotted wait time. A very large or rapidly increasing value indicates a high degree of internal contention. Tuning may be required.
|
| enqueue conversions
| Number of enqueue locks converted to a different mode; for example, from shared to exclusive.
|
| enqueue releases
| Number of times an enqueue (lock) was released. This statistic should keep pace with enqueue requests.
|
| enqueue deadlocks
| The number of process deadlocks that occurred due to enqueues (locks) for DDL operations.
|
Table 11 - 3. Enqueue Statistics
Cache Statistics
Cache statistics provide information on I/O cache performance. The following table describes the cache statistics.
| Cache Statistic
| Description
|
| background checkpoints completed
| The number of times DBWR completes a checkpoint.
|
| background checkpoints started
| The number of times DBWR starts a checkpoint.
|
| buffer busy waits
| The number of times that a user process wanted a buffer in a mode that is incompatible with the current use of that buffer. A high value indicates block level contention.
|
| busy wait time
| Amount of time spent in buffer busy waits in 1/100's of a second.
|
| change write time
| Amount of time spent waiting for redo buffer space, inserting redo information into the buffer, and allocating an SCN, if needed, in 1/100's of a second.
|
| consistent changes
| The number of log changes to produce read-consistent blocks.
|
| consistent gets
| The number of logical reads in read-consistent mode. The sum of this number and db block gets equals logical reads.
|
| cross instance CR read
| The number of times the current instance had to do a consistent read in parallel mode. These tend to be slow, since every instance is told to write out the block. Instance functions should be arranged so that this value is kept small.
|
| db block changes
| The number of logical changes to current database blocks.
|
| db block gets
| The number of requests for the current copy of a block. This number plus consistent gets equals logical reads.
|
| DBWR buffers scanned
| The number of buffers in the lru scanned by DBWR when looking for dirty buffers to flush to disk. This count includes both dirty and clean buffers. Divide by "DBWR lru scans" to get the average number of buffers scanned.
|
| DBWR checkpoints
| The number of times DBWR was notified to do a checkpoint.
|
| DBWR cross instance writes
| The number of blocks written for cross-instance calls so that another instance could do a consistent read.
|
| DBWR exchange waits
| Used in the Parallel Server only, the number of times the DBWR was requested to exchange blocks between instances. Useful only when shown for the DBWR process.
|
| DBWR free buffers found
| The number of buffers that DBWR found already clean when requested to make free buffers. Divide by "DBWR make free requests" to find the average number of reusable buffers at the end of the lru. This value is only incremented when the lru is scanned in response to a make-free request.
|
| DBWR lru scans
| The number of times DBWR does a scan of the lru queue looking for more buffers to write. This includes times when the scan is made to fill out a batch being written for another purpose, such as a checkpoint, so it will always be equal to or greater than "DBWR make free requests".
|
| DBWR make free requests
| The number of requests received by DBWR to make more free buffers for the lru. This includes the times that DBWR sends such a request to itself.
|
| DBWR summed scan depth
| Sum of the current scan depth for each scan of the lru by DBWR when DBWR is looking for dirty buffers. The actual number of buffers scanned may be less than the scan depth, as a result of dirty buffers being placed in the dirty queue by foreground processes. Divide by "DBWR lru scans" to find the average scan depth. Compare this value with the value calculated from "DBWR buffers scanned" to see how much scanning is actually performed.
|
| DBWR timeouts
| The number of timeouts at which DBWR had been idle since the last timeout. These are the times that DBWR looked for buffers to idle write.
|
| dirty buffers inspected
| Number of modified buffers found in the cache. If this value is very large or increasing rapidly, then DBWR is not working fast enough. Tuning may be required.
|
| exchange deadlocks
| The number of times that a process detected a potential deadlock when exchanging two buffers and so raised an internal, restartable error. Index operations are the only operations that perform exchanges. If this number is high, increase the parameters GC_DB_LOCKS and DB_BLOCK_BUFFERS.
|
| free buffer inspected
| The number of buffers skipped in the buffer cache to find a free buffer. High values potentially indicate that user processes are doing too much work and DBWR not enough.
|
| free buffer requested
| The total number of free buffers needed.
|
| free buffer waits
| The number of times a process needed a free buffer (to read from the disk or to make a read-consistent block) and a free buffer was not available.
|
| free wait time
| Time spent waiting for a free buffer, in 1/100's of a second. If this value is very large, or rapidly increasing, then DBWR is not keeping pace with database activity, and tuning may be indicated.
|
| hash latch wait gets
| The number of times latches had to be obtained using waits rather no-wait gets. If this value is large, or rapidly increasing, you can increase the number of hash latches.
|
| lock element waits
| The number of waits for a parallel cache lock.
|
| physical reads
| The number of actual reads of database blocks from disk.
|
| physical writes
| The number of actual writes to disk made by DBWR. For multiple-user systems, this value is always 0, except for DBWR.
|
| redo synch time
| The amount of time waiting for redo logs to be written after a COMMIT in 1/100's of a second.
|
| redo synch writes
| The number of times the redo is forced to disk, usually for transaction commit.
|
| remote instance undo requests
| The number of times this instance acquired an SS lock on undo from another instance in order to perform a consistent read.
|
| remote instance undo writes
| The number of times this instance wrote a dirty undo block so another instance could read it.
|
| summed dirty queue length
| The number of buffers pending for writing. If this value is large, or increasing rapidly, then increase the write-batch size.
|
| write complete waits
| The number of times a process waited for DBWR to write a current block before making a change.
|
| write requests
| The number of multi-block writes performed.
|
| write wait time
| The amount of time spent waiting for DBWR to finish writing a block in the buffer cache before being allowed to change it.
|
Table 11 - 4. Cache Statistics
Parallel Server Statistics
Parallel Server statistics provide information on the Parallel Server. The following table describes the Parallel Server statistics.
| Parallel Server Statistic
| Description
|
| cross instance CR read
| The number of times the current instance had to do a consistent read in parallel mode. These tend to be slow, since every instance is told to write out the block. Instance functions should be arranged so that this value is kept small.
|
| DBWR cross instance writes
| The number of blocks written for cross-instance calls so that another instance could do a consistent read.
|
| global lock converts (asynchronous)
| The number of instance locks that were converted from one mode to another, during which other tasks were enabled.
|
| global lock converts (non-asynchronous)
| The number of instance locks that were converted from one mode to another, during which no other tasks could run.
|
| global lock converts time
| The amount of time spent waiting for instance lock conversion in 1/100's of a second.
|
| global lock gets (asynchronous)
| The number of instance locks that were acquired when other tasks could be enabled during the wait.
|
| global lock gets (non-asynchronous)
| The number of instance locks that were acquired when other tasks could run during the wait.
|
| global lock get time
| The amount of time spent waiting to acquire instance locks in 1/100's of a second.
|
| global lock releases (asynchronous)
| The number of instance locks that were released when other tasks could be enabled during the wait.
|
| global lock releases (nonasynchronous)
| The number of instance locks that were released when other tasks could run during the wait.
|
| global lock release time
| The amount of time spent waiting to release instance locks in 1/100's of a second.
|
| hash latch wait gets
| The number of times latches had to be obtained using waits rather than no-wait gets. If this value is large, or rapidly increasing, you can increase the number of hash latches.
|
| lock element waits
| The number of waits for a parallel cache lock
|
| next SCNs gotten without going to DLM
| The number of SCNs obtained without resorting to Distributed Lock management. To measure the effectiveness of the Parallel Server's SCN cache, divide this value by the total number of SCN gets as given by the user statistic "user commits". This gives the percentage of SCN gets satisfied from the cache.
|
| remote instance undo requests
| The number of times this instance acquired an SS lock on undo from another instance in order to perform a consistent read.
|
| remote instance undo writes
| The number of times this instance wrote a dirty undo block so another instance could read it.
|
Table 11 - 5. Parallel Server Statistics
SQL Tuning Statistics
The SQL tuning statistics provide information on SQL tuning and table characteristics. The following table describes the SQL tuning statistics.
| SQL Tuning Statistic
| Description
|
| cluster key scans
| The number of full table scans or clustered tables performed by fetching rows using the cluster key.
|
| cluster key scan block gets
| The number of blocks read while performing full table scans or clustered tables using the cluster key.
|
| table fetch by rowid
| The number of logical rows fetched from a table.
|
| table fetch continued row
| The number of additional physical fetches required to access broken rows. Divide this number by "table fetch by rowid" for a percentage of broken rows, where rows with multiple breaks count as multiple broken rows.
|
| table scan rows gotten
| The number of rows fetched during full table scans.
|
| table scan blocks gotten
| Number of logical block reads during table scans.
|
| table scans (long tables)
| The number of long table scans. All blocks in excess of the value specified by the parameter SMALL_TABLE_THRESHOLD are immediately resumed, instead of aging out of the lru queue.
|
| table scans (short tables)
| The number of full table scans of short tables. All of the table's blocks are aged out of the lru queue in normal fashion. These tables are smaller than the value of SMALL_TABLE_THRESHOLD.
|
| parse count
| The number of SQL statements parsed.
|
| parse time cpu
| The amount of CPU time spent parsing SQL statements, in 1/100's of a second.
|
| parse time elapsed
| The amount of elapsed time spent parsing SQL statements, in 1/100's of a second.
|
| sorts (disk)
| The number of disk sorts. Each disk sort requires the memory specified by the SORT_AREA_SIZE parameter.
|
| sorts (rows)
| The number of rows sorted.
|
| sorts (memory)
| The number of in-memory sorts. Sorts remain in memory when the total required sort space is less than the value specified by the SORT_AREA_RETAINED_SIZE parameter.
|
Table 11 - 6. SQL Tuning Statistics
Internal Statistics
The remaining statistics are for internal use. At times, some of these statistics may be needed by Oracle personnel to assist in problem identification and resolution.
The Table Access Monitor
The Table Access Monitor lists database objects that are being accessed and the sessions that are accessing them.
The following figure illustrates the left-most columns of the Table Access Monitor.
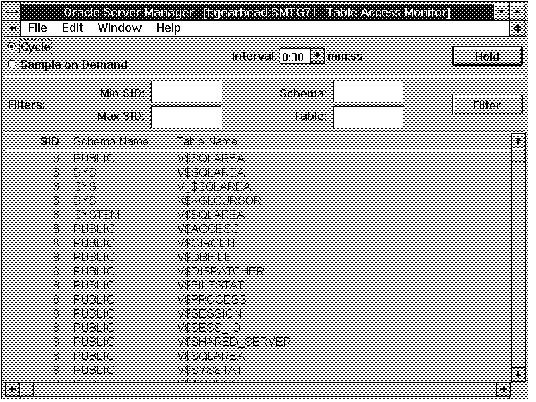 Figure 11 - 15. Table Access Monitor
The Table Access Monitor is described below:
SID Identifier for the session currently accessing the object.
Schema Name
Owner of the object being accessed.
Table Name
Name of the object being accessed.
Filters
The following filters are available in the Table Access Monitor:
Min SID Minimum session ID. Monitor displays sessions with ID numbers greater than or equal to Min SID.
Max SID
Maximum session ID. Monitor displays sessions with ID number less than or equal to Max SID.
Schema
Filter for owner name. Monitor displays information for objects whose owners match the Schema filter.
Table
Filter for object names. Monitor displays information for objects whose names match the Table filter.
SQL Worksheet Equivalent
To start the Table Access Monitor from a SQL Worksheet, you can use the following Server Manager commands:
MONITOR TABLEACCESS
MONITOR TABLE
Required Views
To use the Table Access Monitor, you must have access to:
Interpreting Table Access Statistics
Use the Session Monitor to look up the user associated with a particular SID listed in the Table Access Monitor.
The Tablespace Monitor
The Tablespace Monitor displays information about the tablespaces in the database.
The following figure illustrates the left-most columns of the Tablespace Monitor.
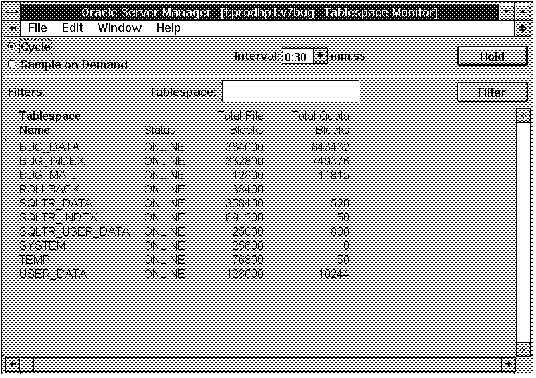 Figure 11 - 16. Tablespace Monitor
The Tablespace Monitor is described below:
Tablespace Name Name of the tablespace.
Status
Status of the tablespace: ONLINE or OFFLINE.
Total File Blocks
Size of the tablespace in database blocks.
Total Quota Blocks
Number of database blocks currently allocated to users' objects in the tablespace.
Filters
The following filter is available in the Tablespace Monitor:
Tablespace Filter for the tablespace name. Monitor displays information for tablespaces whose names match the Tablespace filter.
SQL Worksheet Equivalent
To start the Tablespace Monitor from a SQL Worksheet, you can use the following Server Manager command:
MONITOR TABLESPACE
Required Views
To use the Tablespace Monitor, you must have access to:
 Figure 11 - 1. Circuit Monitor
 Figure 11 - 2. Dispatcher Monitor
 Figure 11 - 3. File I/O Monitor
 Figure 11 - 4. Latch Monitor
 Figure 11 - 5. Library Cache Monitor
 Figure 11 - 6. Lock Monitor
 Figure 11 - 7. Process Monitor
 Figure 11 - 8. Queue Monitor
 Figure 11 - 9. Rollback Monitor
 Figure 11 - 10. Session Monitor
 Figure 11 - 11. Shared Server Monitor
 Figure 11 - 12. SQL Area Monitor
 Figure 11 - 13. System I/O Monitor
 Figure 11 - 14. System Statistics Monitor
 Figure 11 - 15. Table Access Monitor
 Figure 11 - 16. Tablespace Monitor