Release 1.5
A56287-01
Library |
Product |
Contents |
Index |
| Oracle Parallel Server Management User's Guide Release 1.5 A56287-01 |
|
This chapter presents the Performance Manager charts specific to Oracle8 Parallel Servers. You must have Performance Manager installed on the Enterprise Manager Console to display these Oracle Parallel Server Performance Manager charts.
|
IMPORTANT: If you are planning to use OPS Performance Manager with Oracle7, you must install the PL/SQL package. For use with Oracle8, you must run a SQL script on the monitored system. Refer to Appendix A, "OPS Performance Monitoring for Oracle Parallel Server" for more information in both cases. |
This chapter discusses the following topics:
| Topic | Refer to Page |
|---|---|
Performance Manager displays a variety of tabular and graphic performance statistics for parallel servers. The statistics represent the aggregate performance of all instances running on a parallel server. The statistics are displayed in individual charts and include information on data block pings, lock activity, file I/O, and session and user information. You can also use the Performance Manager to display an overview of all of these statistics on one chart.
Oracle Parallel Server performance monitoring is crucial for realizing the full potential of the system. There are several key performance metrics which need to be constantly monitored to keep the Oracle Parallel Server in peak operating condition. The Performance Manager, available as an applet within Enterprise Manager, is an application designed to capture, compute, and present performance data that help database administrators focus on key performance metrics.
The following are the Oracle Parallel Server performance metrics which can be monitored by Oracle Parallel Server:
|
Note: Right-clicking on a displayed chart displays a menu allowing you to drill down from or customize the chart. |
From the Display menu, choose the Parallel Server>Parallel Server Total Block Pings command to display a bar chart which represents the total block pings on the parallel server. You can drill down to view the block pings on tablespaces and objects within the parallel server. Similarly, you can drill down on individual tablespaces and objects to view the block pings on individual instances.
The Total Block Pings chart displays statistics from the V$PING view.
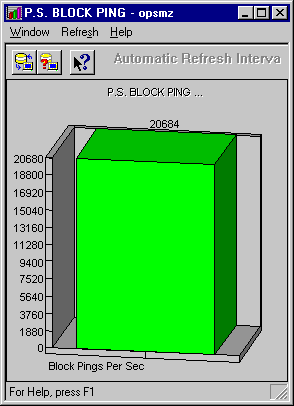
To display the block pings at the tablespace level or at the instance level:
Table 3-1 Total Block Pings Options at the Tablespace Level
| Option | Description |
|---|---|
|
Instance |
Select Instance to view the pinging on individual instances in the parallel server. You cannot drill down below the instance level. For more information about this chart, see "Data Block Pings by Instance Chart" on page 3-7. |
|
Object |
Select Object to display the pinging on the tablespaces in the parallel server. From the tablespace level, you can click an individual tablespace and drill down again. For more information about this chart, see "Data Block Pings by Tablespace Chart" on page 3-6. |
To display the block pings at the object level or at the instance level:
Table 3-2 Total Block Pings Options at the Instance Level
To display the block pings at the instance level for the selected object:
From the Display menu, choose the Parallel Server>Parallel Server Block Pings by Tablespace command to display a bar chart which represents the total block pings on the individual tablespaces in the parallel server. You can drill down on individual tablespaces to view the block pings on individual objects and instances.
The Block Pings by Tablespace chart displays statistics from the V$PING view.

To display the block pings at the object level or at the instance level:
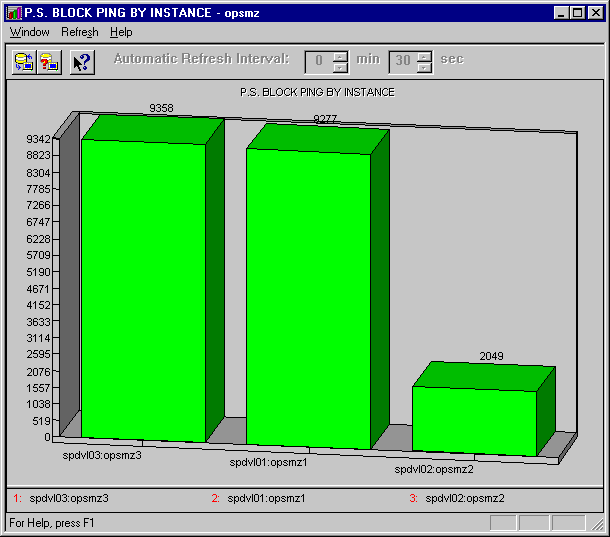
From the Display menu, choose the Parallel Server>Parallel Server Block Pings by Instance command to display a bar chart which represents the total block pings on the individual instances in the parallel server. You cannot drill down below the instance level. The Block Pings by Instance chart displays statistics from the V$PING view.
From the Display menu, choose the Parallel Server>Parallel Server Sessions command to display a table of Session IDs. The table includes columns for Instance Name, Session ID, Session Address, Session Serial Number, Process PID, Status, Username, Lockwait, and Command.
The Sessions chart displays statistics from the V$PROCESS and V$SESSION views.

From the Display menu, choose the Parallel Server>Parallel Server Total File I/O Rate command to graphically display the rate of physical reads and writes for all files in the parallel server database. Only information about Oracle files is shown in this chart.
The Total File I/O Rate chart displays statistics from the V$FILESTAT view.

To display the file I/O rate at the instance level or at the file level:
Table 3-4 Total File I/O Rate Options at the Instance and File Level
| Option | Description |
|---|---|
|
Instance |
Select Instance to view the file I/O rate on individual instances in the parallel server. You cannot drill down below the instance level. For more information about this chart, see "File I/O Rate by Instance Chart" on page 3-12. |
|
Object |
Select Object to view the file I/O rate on individual files on the parallel server. For more information about this chart, see "File I/O Rate by File Chart" on page 3-11. |
To view the file I/O rate of individual instances within the selected file:
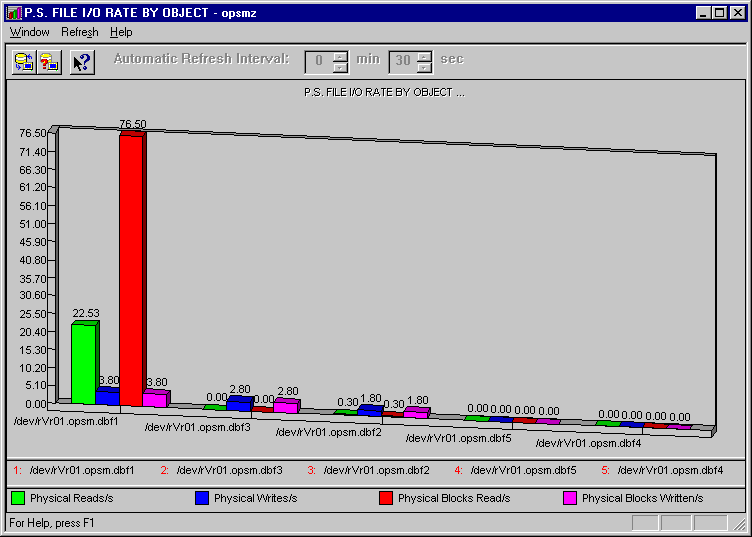
From the Display menu, choose the Parallel Server>Parallel Server File I/O Rate by File command to graphically display the rate of physical reads and writes for individual files in the parallel server database. Only information about Oracle files is shown in this chart. The File I/O Rate by File chart displays statistics from the V$FILESTAT view.
To display the file I/O rate at the instance level:
Table 3-5 File I/O Rate by File Options at Instance Level
| Option | Description |
|---|---|
|
Instance |
Select Instance to view the file I/O rate on individual instances in the parallel server. You cannot drill down below the instance level. |
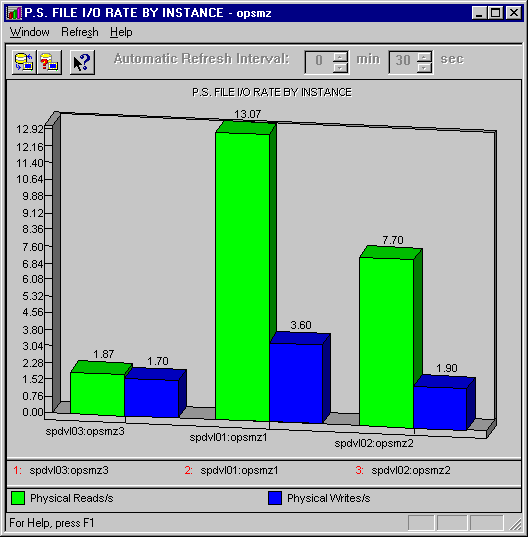
From the Display menu, choose the Parallel Server>Parallel Server File I/O Rate by Instance command to graphically display the rate of physical reads and writes for individual instances in the parallel server database. Only information about Oracle files is shown in this chart. You cannot drill down below the instance level.
The File I/O Rate by Instance chart displays statistics from the V$FILESTAT view.
From the Display menu, choose the Parallel Server>Parallel Server Lock Activity command to display statistics on the lock activity rate for all different lock types parallel server-wide.
The Lock Activity chart displays statistics from the V$LOCK_ACTIVITY view.
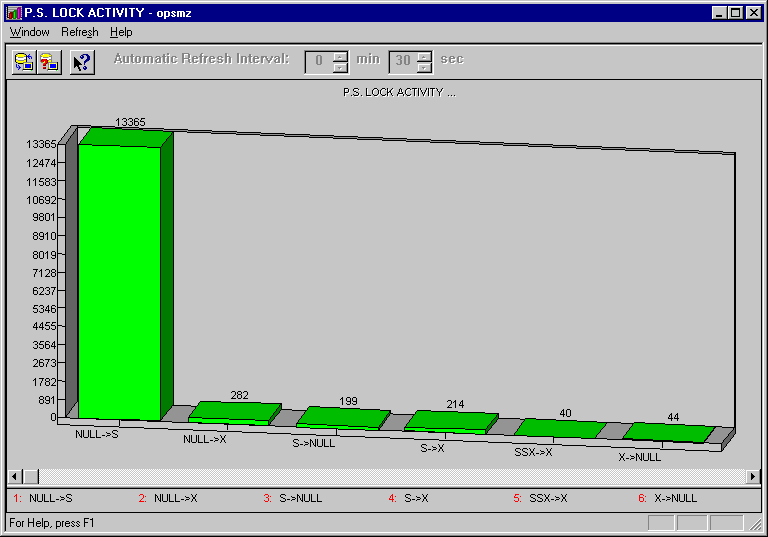
To view the total lock activity by instance for the selected lock type:
Table 3-6 Lock Activity Option at the Instance Level
| Option | Description |
|---|---|
|
Instance |
Select Instance to view the total lock activity by instance for the selected lock type. You cannot drill down below the instance level. |
From the Display menu, choose the Parallel Server>Parallel Server Active Users command to display the total number of active user sessions on the parallel server. The Active Users chart displays statistics from the V$SESSION view.
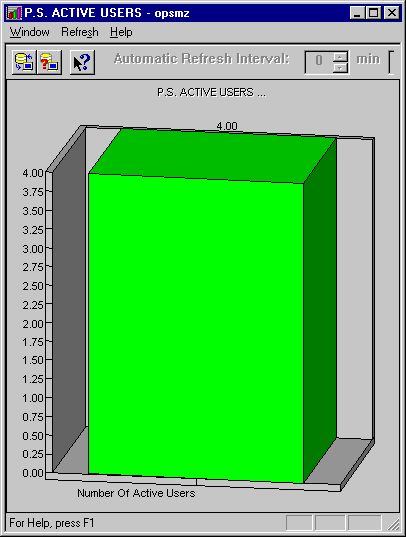
To view the active user sessions on each instance on the parallel server:
Table 3-7 Active User Option at the Instance Level
| Option | Description |
|---|---|
|
Instance |
Select Instance to view the active users on each instance in the parallel server. You cannot drill down below the instance level. For more information about this chart, see the "Active Users by Instance Chart" on page 3-15. |
From the Display menu, choose the Parallel Server>Parallel Server Active Users by Instance command to display the number of active user sessions on each instance in the parallel server. You cannot drill down below the instance level.
The Active Users by Instance chart displays statistics from the V$SESSION view.
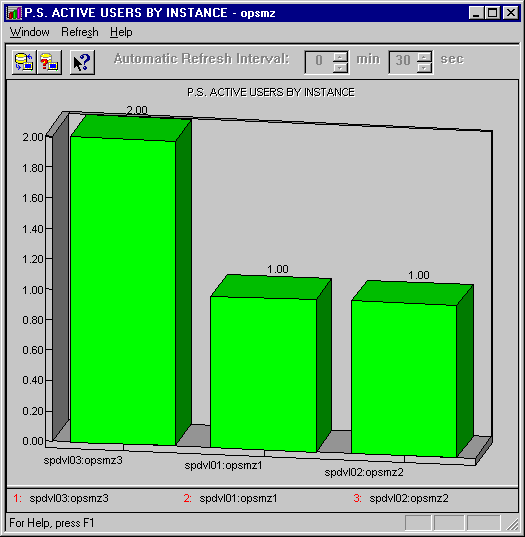
From the Display menu, choose the Parallel Server>Parallel Server Users Logged On command to display the total number of user sessions currently logged on to the parallel server, whether or not activity is being generated.
The Users Logged On chart displays statistics from the V$LICENSE view.

To view the number of user sessions currently logged on to each instance on the parallel server:
| Option | Description |
|---|---|
|
Instance |
Select Instance to view the number of user sessions currently logged on to each instance in the parallel server. For more information about this chart, see "Users Logged On by Instance Chart" |
From the Display menu, choose the Parallel Server>Parallel Server Users Logged On by Instance command to display the number of users logged on to each instance in the parallel server. You cannot drill down below the instance level.
The Users Logged On by Instance chart displays statistics from the V$LICENSE view.
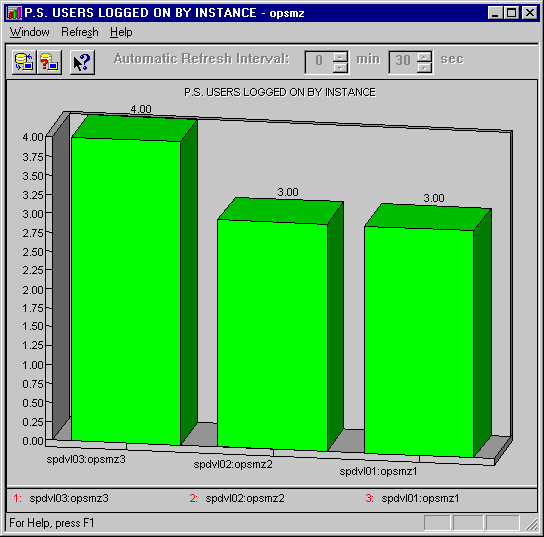
From the Display menu, choose the Parallel Server>Overview command to display all performance statistics charts. Run this command to display the Total Block Pings, Sessions, Total File I/O Rate, Lock Activity, Active Users, and Users Logged On charts as individual tiles.
