| Oracle® High Availability Architecture and Best Practices 10g Release 1 (10.1) Part Number B10726-01 |
|
|
View PDF |
| Oracle® High Availability Architecture and Best Practices 10g Release 1 (10.1) Part Number B10726-01 |
|
|
View PDF |
This chapter provides recommendations for using Oracle Enterprise Manager to monitor and maintain a highly available environment across all tiers of the application stack. In addition, it describes how to create an Enterprise Manager configuration that is highly available.
Continuous monitoring of the system, network, database operations, application, and other system components ensures early detection of problems. Early detection improves the user's system experience because problems can be resolved faster. In addition, monitoring captures system metrics to indicate trends in system performance growth and recurring problems. This information can facilitate prevention, enforce security policies, and manage job processing. For the database server, a sound monitoring system needs to measure availability and detect events that can cause the database server to become unavailable and provide immediate notification to responsible parties for critical failures.
The monitoring system itself needs to be highly available and adhere to the same operational best practices and availability practices as the resources it monitors. Failure of the monitoring system leaves all systems that it monitors unable to capture diagnostic data or alert the administrator of problems.
Oracle Enterprise Manager provides the management and monitoring capabilities with many different notification options. This chapter provides recommendations for using Enterprise Manager to monitor and maintain a highly available environment across all tiers of the application stack. Recommendations are available for methods of monitoring the environment's availability and performance and for using the tools in response to changes in the environment. In addition, there is a description of how to create an Enterprise Manager configuration that is highly available, as well as additional configuration tips.
This section provides an overview of the concepts and facilities available in Enterprise Manager.
A major benefit of Enterprise Manager is its ability to manage components across the entire application stack from the host operating system to a user or packaged application. Enterprise Manager treats each of the layers in the application as a target. Targets, such as databases, application servers, and hardware, can then be viewed along with other targets of the same type or can be grouped together by application type. All targets can also be reviewed in a single view. Each target type has a default generated home page that displays a summary of relevant details for a specific target. Different types of targets can be grouped together by function, that is, as resources that support the same application.
Every target is monitored by an Oracle Management Agent. Every Management Agent runs on a machine and is responsible for a set of targets. The targets can be on a machine that is different from the machine that the Management Agent is on. For example, a Management Agent can monitor a storage array that cannot host an agent natively. When a Management Agent is installed on a host, the host is automatically discovered along with other targets that are on the machine.
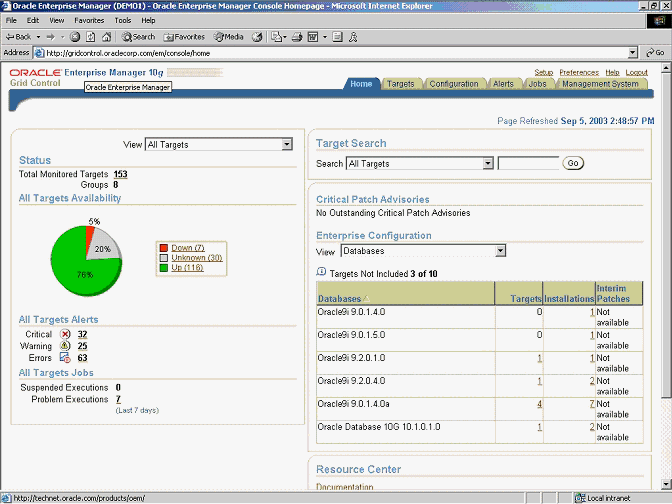
The Grid Control home page shown in Figure 8-1 provides a picture of the availability of all of the discovered targets.
Text description of the illustration initial.gif
The Grid Control home page shows the following major kinds of information:
Alerts are generated by a combination of factors and are defined on specific metrics. A metric is a data point sampled by a Management Agent and sent to the Oracle Management Repository. It could be the availability of a component through a simple heartbeat test or an evaluation of a specific performance measurement such as "disk busy" or percentage of processes waiting for a specific wait event.
There are four states that can be checked for any metric: error, warning, critical, and clear. The administrator must make policy decisions such as:
All of these decisions are predicated on the business needs of the system. For example, all components may be monitored for availability, but some systems may be monitored only during business hours. Systems with specific performance problems can have additional performance tracing enabled to debug a problem.
The rest of this section includes the following topics:
See Also:
|
Notification Rules are defined sets of alerts on metrics that are automatically applied to a target when it is discovered by Enterprise Manager. For example, an administrator can create a rule that monitors the availability of database targets and generates an e-mail message if a database fails. After that rule is generated, it is applied to all existing databases and any database created in the future. Access these rules by navigating to Preferences and then choosing Rules.
The rules monitor problems that require immediate attention, such as those that can affect service availability and Oracle or application errors. Service availability can be affected by an outage in any layer of the application stack: node, database, listener, and critical application data. A service availability failure, such as the inability to connect to the database, or the inability to access data critical to the functionality of the application, must be identified, reported, and reacted to quickly. Potential service outages such as a full archive log directory also need to be addressed correctly to avoid a system outage.
Enterprise Manager provides a series of default rules that provide a strong framework for monitoring availability. A default rule is provided for each of the preinstalled target types that come with Enterprise Manager. These rules can be modified to conform to the policies of each individual site, and new rules can be created for site-specific targets or applications. The rules can also be set to notify users during specific time periods to create an automated coverage policy.
Consider the following recommendations:
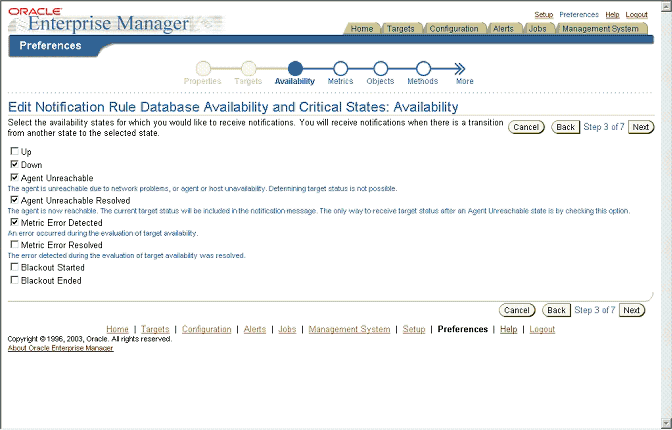
Figure 8-2 shows the Notification Rule property page for choosing availability states. Down, Agent Unreachable, Agent Unreachable Resolved, and Metric Error Detected are chosen.
Text description of the illustration avail.gif
In addition, modify the metrics monitored by the database rule to report the metrics shown in Table 8-1, Table 8-2, and Table 8-3. This ensures that these metrics are captured for all database targets and that trend data will be available for future analysis. All of the events described in Table 8-1, Table 8-2, and Table 8-3 can be accessed from the Database Homepage. Choose All Metrics > Expand All.
Space management conditions that have the potential to cause a service outage should be monitored using the events shown in Table 8-1.
From the Alert Log Metric group, set Enterprise Manager to monitor the alert log for errors as shown in Table 8-2.
Monitor the system to ensure that the processing capacity is not exceeded. The warning and critical levels for these events should be modified based on the usage pattern of the system. Set the events from the Database Limits metric group. Table 8-3 contains the recommendations.
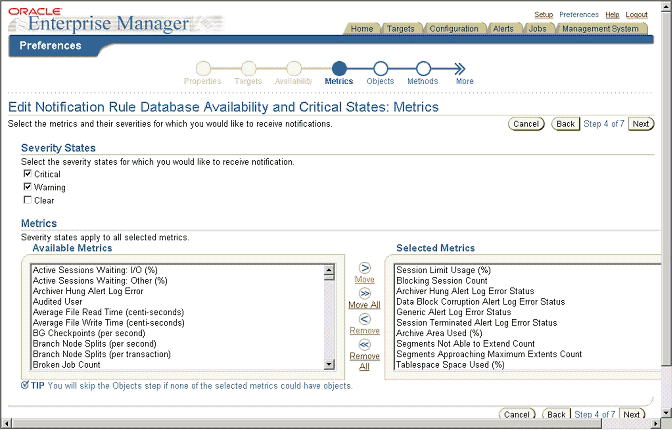
Figure 8-3 shows the Notification Rule property page for setting choosing metrics. The user has chosen Critical and Warning as the severity states for notification. The list of Available Metrics is shown in the left list box. The metrics that have been selected for notification are shown in the right list box.
Text description of the illustration metrics.gif
| See Also:
Oracle Database 2 Day DBA for information about setting up notification rules and metric thresholds |
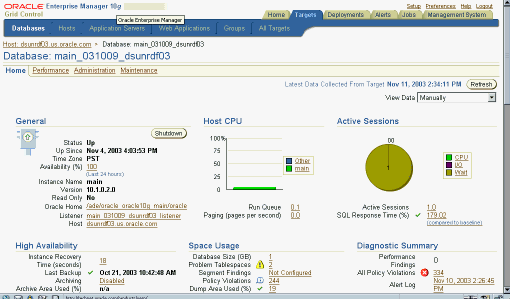
The Database Targets page in Figure 8-4 shows an overview of system performance, space utilization, and the configuration of important availability components like archived redo log status, flashback log status, and estimated instance recovery time. Alerts are displayed immediately. Each of the alert values can be configured from links on this page
Text description of the illustration overv.gif
Many of the metrics from the Enterprise Manager pertain to performance. A system without adequate performance is not an HA system, regardless of the status of any of the individual components. While performance problems seldom cause a major system outage, they can still cause an outage to a subset of customers. Outages of this type are commonly referred to as application service brownouts. The primary cause of brownouts is the intermittent or partial failure of one or more infrastructure components. IT managers must be aware of how the infrastructure components are performing (their response time, latency, and availability) and how they are affecting the quality of application service delivered to the end user.
A performance baseline, derived from normal operations that meet the SLA, should determine what constitutes a performance metric alert. Baseline data should be collected from the first day that an application is in production and should include the following:
You can use Enterprise Manager to capture a snapshot of database performance as a baseline. Enterprise Manager compares these values against system performance and displays the result on the database Target page. It can also send alerts if the values deviate too far from the established baseline.
Set the database notification rule to capture the metrics listed in Table 8-4 for all database targets. Analysis of these parameters can then be done using one tool and historical data will be available.
| See Also:
Oracle Database Performance Tuning Guide for more information about performance monitoring |
There are many operating system events that can be used to supplement a suggested metric. Such operating system events are not required for each host and instance. All metrics defined here can be set individually by instance or database using the Manage Metrics link at the bottom of the navigation bar of the object target page. The values that trigger a warning or critical alert can be changed here, and an operating system script can be activated to respond to an metric threshold, in addition to the standard alert being generated to the Oracle Enterprise Manager 10g Grid Control.
Set Enterprise Manager metrics to monitor the availability of logical and physical Data Guard configurations. If a Data Guard environment is registered with the Data Guard Manager extension of Enterprise Manager, then set the events shown in
Use Enterprise Manager as a proactive part of administering any system as well as for problem notification and analysis. This section includes the following recommendations:
Enterprise Manager comes with a pre-installed set of policies and recommendations of best practices for all databases. These policies are checked by default, and the number of violations is displayed on the Targets page in Figure 8-4. Select Policy Violations from the Targets page to see a list of all violations.
You can use Enterprise Manager to download and manage patches from http://metalink.oracle.com for any monitored system in the application environment. A job can be set up to routinely check for patches that are relevant to the user environment. Those patches can be downloaded and stored directly in the Management Repository. Patches can be staged from the Management Repository to multiple systems and applied during maintenance windows.
You can examine patch levels for one machine and compare them between machines in either a one-to-one or one-to-many relationship. In this case, a machine can be identified as a baseline and used to demonstrate maintenance requirements in other machines. This can be done for operating system patches as well as database patches.
Enterprise Manager can be used to set up logical and physical standby databases for any database target. It also provides the ability to manage switchover and failover of database targets other than the database that contains the Management Repository.
Enterprise Manager can also be used to monitor the health of a Data Guard configuration at a glance. From any database target page, navigate to the Data Guard status section by using the link in the High Availability section. The page shows the active standby databases for the primary target, the amount of log data waiting for shipment and receipt by the standby database and the data protection mode. You can also modify the data protection mode from this page.
This page contains a link to the Verify function, which checks the Data Guard environment and log transport services and displays warnings and errors. The Verify function must be run manually; it is not automatic.
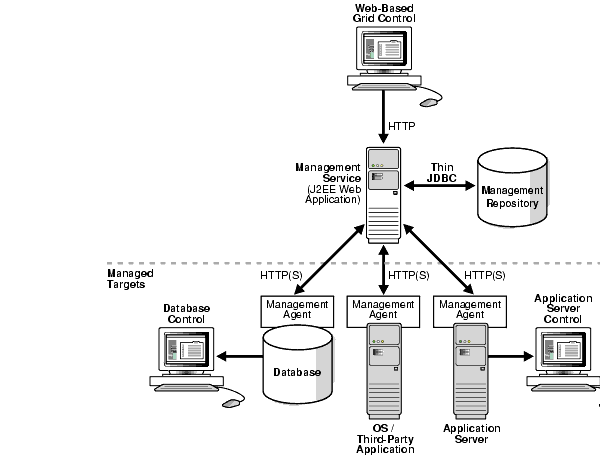
The Enterprise Manager architecture consists of a three-tier framework as shown in Figure 8-5.
Text description of the illustration maxav033.gif
The components of the architecture are as follows:
Enterprise Manager provides a detailed set of tools to monitor itself.
The Management System page is a predefined component of Enterprise Manager that shows the administrator an overview of the Enterprise Manager components, backlogs in processing agent data, and component availability.
The Management System page shows essential metrics, including the amount of space left in the repository and the amount of data waiting to be loaded to the repository. This page also provides a view of alerts or warnings against the management system. The Repository Operations page provides an overview of the individual component tasks that make up the management system. The Repository Operations page shows the individual components at a glance, including the amount of CPU resource consumed and processing errors. A default notification rule is created when the product is installed and should be configured to notify the system administrator of a problem with any Enterprise Manager component.
Set the following options to monitor an Enterprise Manager environment:
emd.properties with a valid e-mail address and mail server for any agent that monitors an Management Service or Management Repository node. This provides Enterprise Manager an additional method of notification if the repository fails. Instructions for setting emd.properties are in the Tip section of the Grid Control home page.The rest of this section includes the following topics:
The following recommendations are described in this section:
Availability requirements need to be addressed for each layer of the Enterprise Manager stack. The minimum recommendation for the Enterprise Manager repository and processes is to host them in a configuration that has the same protections as the system with the highest level of availability monitored by Enterprise Manager. The Enterprise Manager architecture must be as reliable as the application architecture. It is crucial for the monitoring framework to detect problems and manage repair as efficiently as possible. The Enterprise Manager implementation should be designed to be as available as the most available application it monitors because the Enterprise Manager framework is used to generate alerts if any monitored application fails.
The Management Repository is the foundation of all Enterprise Manager operations. If the Enterprise Manager system is being used to monitor and alert on a system using a RAC and Data Guard configuration, but the Management Repository is hosted only on a single instance, then an outage of the Enterprise Manager system puts the administrator at risk of not being notified in a timely fashion of problems in production systems. Consider placing the Management Repository in a RAC instance to protect from individual instance failure and using Data Guard to protect from site failure.
For the middle tier, the baseline recommendation is to have a minimum of two Management Service processes, using a hardware server load balancer to mask the location of an individual Management Service process and a failure of any individual component. This provides immediate coverage for a single failure in the most critical components in the Enterprise Manager architecture with little interruption of service for all systems monitored using Enterprise Manager. Hardware server load balancers can also be monitored and configured using Enterprise Manager, providing coverage across the operating system stack. Management Service processes connect to the repository instances using Oracle Net.
To reduce hardware overload and use current resources, the repository and Management Service processes can be hosted on the same hardware as another highly available production system. This assumes that the secondary site has the capacity and bandwidth to handle the production load plus an active Enterprise Manager repository and Management Service process. A hardware service load balancer should be used as a front end for multiple Management Service processes to manage failure of an individual Management Service and to balance the workload across the middle tier.
Agents from any monitored node in the environment can connect to any active Management Service processes. Load balancing of the agent processes connecting to the Management Service processes is handled internally by Enterprise Manager.
Sufficient network bandwidth must be available to support the communication between the Management Service processes and the Management Agents. If the repository is used to manage a larger enterprise, then communication between agents and Management Service processes can be significant, depending on the number of scheduled events and jobs. If the Enterprise Manager framework is used to monitor multiple applications and more dedicated system resources are required, then consider scaling the Management Repository and Management Service processes with additional nodes. The Management Repository and Management Service processes can be scaled independently. If required, additional hardware outside of the cluster can be added to scale the number of Management Service processes.
Enterprise Manager is the primary control interface for managing your data center. An outage of Enterprise Manager causes a critical lack of visibility into the performance and availability metrics that allow the DBA to manage overall system performance. Table 8-6 describes the outages that can occur to any of the tiers involved in Enterprise Manager and how to recover from each outage.
| Type of Outage | Possible Reasons for Outage | Solutions or Alternatives |
|---|---|---|
|
Management Repository instance failure |
Hardware failure, Oracle database failure, network failure to a single node of a RAC instance on the primary site, listener failure |
This is best managed by using a RAC environment for the Management Repository. In a RAC environment, connections reconnect to the second node using Oracle Net failover. When the failed node is restored, the load is rebalanced automatically. |
|
Primary site failure |
Network outage to both nodes, cluster failure, interconnect failure, hardware failure |
Requires Data Guard failover to secondary site:
Note: This cannot be managed by Enterprise Manager directly. See "Data Guard Failover Using SQL*Plus". |
|
Management Agent failure |
Process failure, accidental user termination |
The Management Agent watchdog process restarts the Management Agent. The number of restarts is bounded by user-configurable parameters to avoid unnecessary processing on the monitored node. |
|
Watchdog failure |
Process failure, accidental user termination |
No data is reported. Logging stops for the Management Agent. Any hanging processes must be manually stopped, and the Management Agent must be restarted. Note: The watchdog failure is not reported back to the Enterprise Manager GUI. |
|
System state data is deleted or corrupted |
Agent failure, user deletion of state files |
Stop Management Agent processes ( Restart the agent ( |
|
Management Service process failure |
Process failure, accidental user termination |
The Oracle Process Manager and Notification Server (OPMN) restarts the Management Service. A server load balancer (SLB) can be used for multiple Management Service processes. This masks process failures and distributes the workload across the middle tier. Failure of a Management Service causes the GUI session connected to it to fail. The GUI session must be restarted on a surviving Management Service. |
|
Oracle Process Manager and Notification Server (OPMN) failure |
Process failure, accidental user termination |
No data is reported; logging stops for the Management Service process. Hanging processes need to be manually killed (on UNIX platforms) and the agent needs to be restarted. Note: Death of the watchdog is not reported back to the Enterprise Manager GUI. |
|
Grid Control disconnect |
Grid Control loses connection to Management Service because of a network problem, Management Service failure, or node failure |
Because the Grid Control is stateless, it receives data from Management Service processes. The failure is resolved by connecting to a surviving Management Service or by starting the Grid Control itself. |
This section contains additional configuration information that will be helpful in building Enterprise Manager in an MAA environment. It includes the following topics:
Traffic from the Management Agents is routed to the Management Service processes and then to the Management Repository by Oracle Net. To isolate this traffic from other application traffic and to support Data Guard if required for site failover, configure the Enterprise Manager traffic through a separate listener. The listener is active only on the node where the active Enterprise Manager instance is running. Do not set the GLOBAL_DBNAME parameter in the listener.ora file because setting it disables Transparent Application Failover (TAF) and connect-time failover. Configure the LOCAL_LISTENER and REMOTE_LISTENER initialization parameters to enable dynamic service registration and cross-registration. The following is an example of a listener configuration:
LISTENER_N1=
        (description_list=
             (description=
               (address_list=
                (address=(protocol=tcp)(port=1521)(host=EMPRIM1.us.oracle.com))
               )
             )
        )
SID_LIST_LISTENER_N1 =
  (SID_LIST =
    (SID_DESC =
      (ORACLE_HOME = /mnt/app/oracle/product/10g)
      (SID_NAME = EM1)
    )
  )

LISTENER_DG=
        (description_list=
             (description=
               (address_list=
                (address=(protocol=tcp)(port=1529)(host=EMPRIM1.us.oracle.com))
               )
             )
        )
To avoid installation problems when building a RAC-based repository, it is easier to install the Enterprise Manager into an existing database and build any tablespaces in advance. Certain versions of the Oracle Universal Installer do not handle installing the repository into a RAC database. Build the database first; then use the Install option to install into an existing database.